fbpx

Newsletter

SUBSCRIBE TO OUR POSTS

Share on facebook
Share on twitter
Share on linkedin

Arizona Real Estate Market Update – January 2024

Share on facebook
Share on google
Share on twitter
Share on linkedin

Check Out Arizona's Real Estate Scene: January 2024 Update

In the world of real estate, it’s important to know what’s happening in the market. Let’s take a closer look at the numbers from ARMLS on January 1, 2024, and compare them with those from the same day in 2023. This will help us understand how the real estate scene is changing and make informed decisions whether you’re looking to buy or sell.

Real Estate has now become a bigger expense along with daily expenses, and the data does not lie.  Demand and supply are the biggest indicators of where the market is heading and supply still remains low while demand is still high enough.  When interest rates fall, sellers maybe intrigued to switch homes increasing supply, but the pent up demand is real.  Its a delicate balance.  It’s frustrating for a lot of buyers right now with the high payments and renting does seem to be a better option in a lot of cases. We are heading into the busy season so expect prices to rise for the time being.  

For a more comprehensive report tailored to your city or zip code, feel free to reach out! Call me at (480) 466-4917 or email me at jay@jaybrugroup.com.

For more insights, refer to the charts and direct information from the Cromford report in the provided links.🏡👍

Here are the basics: the ARMLS numbers for January 1, 2024, compared with those from January 1, 2023, for all areas and types.

  • Active Listings (excluding UCB & CCBS): 14,593, a 10.5% decrease from 16,298 last year.  This has been Arizona’s biggest struggle to build enough homes for the people living here. 

  • Pending Listings: 3,263, marking a 10.8% drop from 3,657 last year.  Still low amounts of sales happening in Arizona. 

  • Under Contract Listings (including Pending, CCBS & UCB): 5,127, reflecting a 6.0% decrease from 5,456 last year, and a 12.6% decline from 5,867 last month.

  • Monthly Sales: 4,929, a 4.1% decrease from 5,138 last year, but a 6.4% increase from 4,634 last month.

  • Monthly Average Sales Price per Sq. Ft.: $284.85, up 7.1% from $265.90 last year, yet down 1.5% from $289.30 last month. Prices are continuing to rise.

  • Monthly Median Sales Price: $429,990, showing a 4.4% increase from $412,000 last year, but a 2.1% decrease from $439,000 last month.

From the cromford report:

The market has improved for sellers in some ways since last month. The supply of active listings is down almost 9% since December 1 and more than 10% from a year ago. It is always good for a seller to have less competition from other homes. The monthly sales count for December improved over November but is still down from a year ago when things were already not too good. So this is neutral for sellers. The pending and under-contract counts are downright bad for sellers, down sharply from last month and significantly lower than a year ago, but real estate is seasonal and the fall is typically slow. 

Considering how much mortgage rates have fallen in the last two months, the numbers can be described as fairly disappointing from a seller’s perspective. Lower mortgage rates are supposed to attract more buyers. So far, that is barely noticeable. From a buyer’s perspective, this is good news because they have less competition to worry about.

Prices are still stable, having risen by more than 7% from this time last year when measured by $/SF, and up 4.4% when measured by median sales price. This increase is slightly more than the latest rise in the Consumer Price Index. The strength in pricing in the luxury market accounts for the difference between the two price measurements. Median sales prices are influenced more by the entry-level and mid-range markets, which have been weaker than the top end.

We are still lacking sufficient 2024 data to determine the direction in which things are heading. Both supply and demand are increasing, as expected in January. Supply has risen by 0.5% in the first 3 days, while listings under contract are up by 3%. Although the data is limited, the indicators are more favorable for sellers than buyers. The contract ratio has increased from 35.13 to 35.98. This is consistent with a neutral, balanced market, but the trend is once again leaning in favor of sellers.

I would say there is a case for (very) mild optimism. There is certainly no sign whatsoever of a housing market crash.

What the market needs most now is higher transaction volumes. I do not yet know if that is coming, but hoping it is legitimate.

For Buyers:

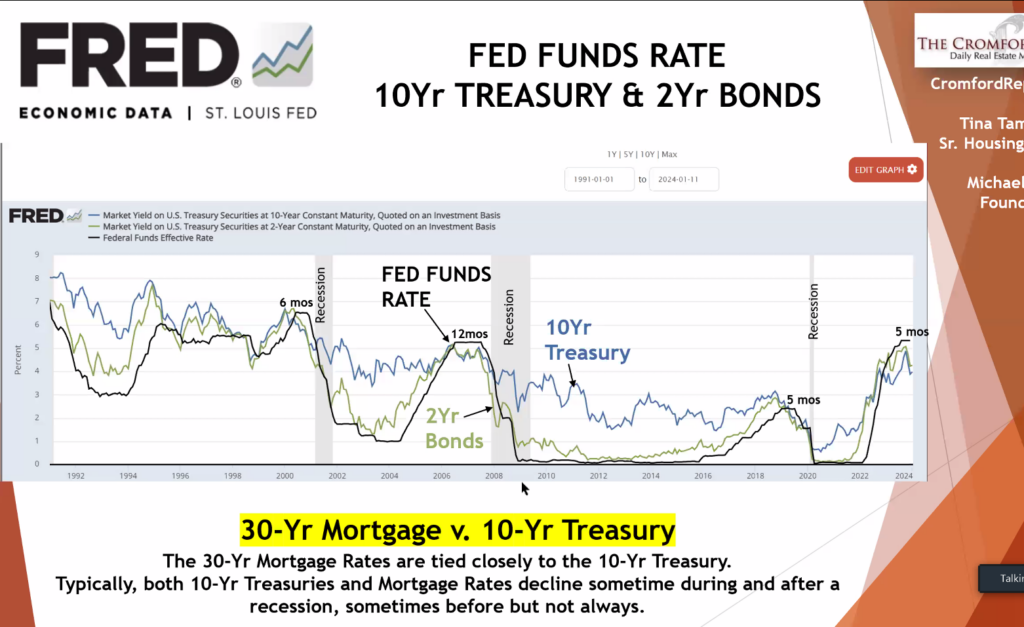
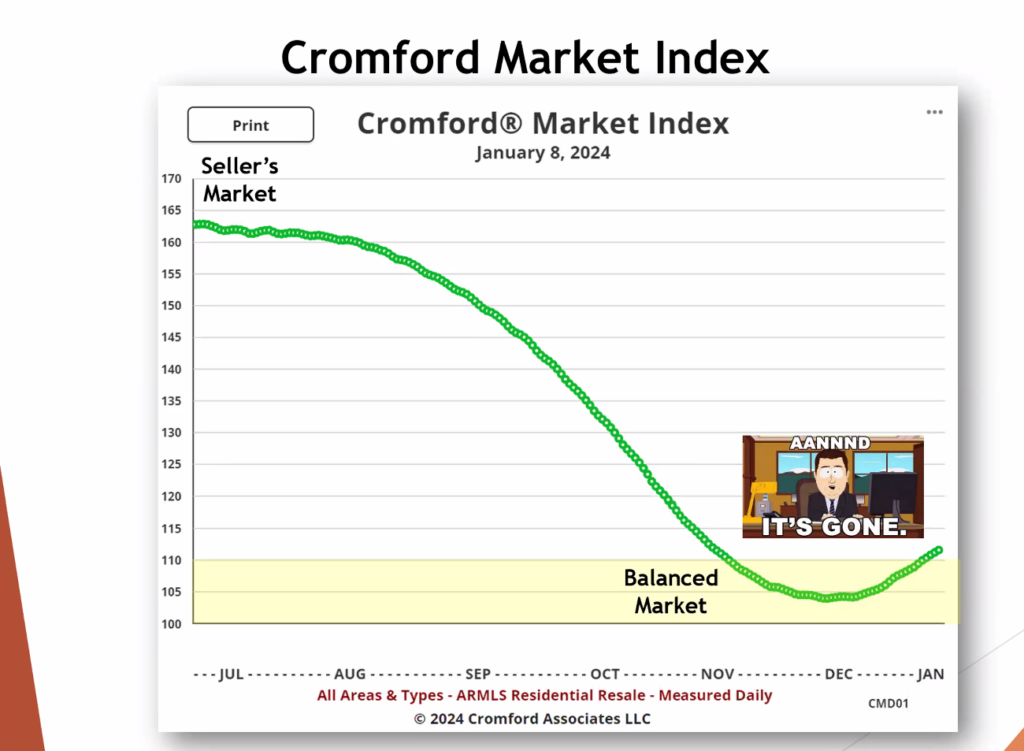
Well, the balanced market didn’t last long, precisely 7 weeks. Last month, the Federal Reserve provided the housing industry with a much-needed gift. Not only did they refrain from raising the Federal Funds Rate, but they also announced their intention to decrease it three times in 2024. Conventional mortgage rates responded by dropping from 7.1% to 6.62% within 2 days. Mortgage rates have now decreased by 1.4% since peaking at 8% in October 2023, resulting in a savings of nearly $380 per month on a $400,000 loan—an impressive payment decline of 13%. For perspective, each time the rate drops by 1%, the mortgage payment can decrease between 9-10%, depending on the starting point, in many cases saving at least $200/month*. This rate drop was significant enough to give December’s mortgage applications a boost, which could be a precursor to January’s accepted contract counts.

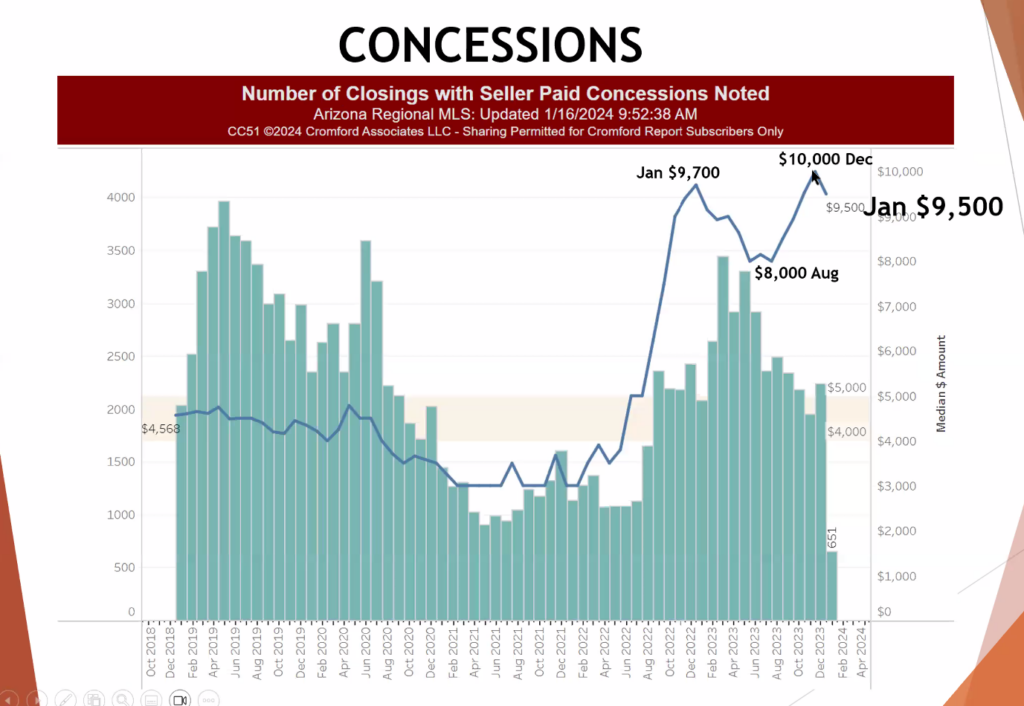
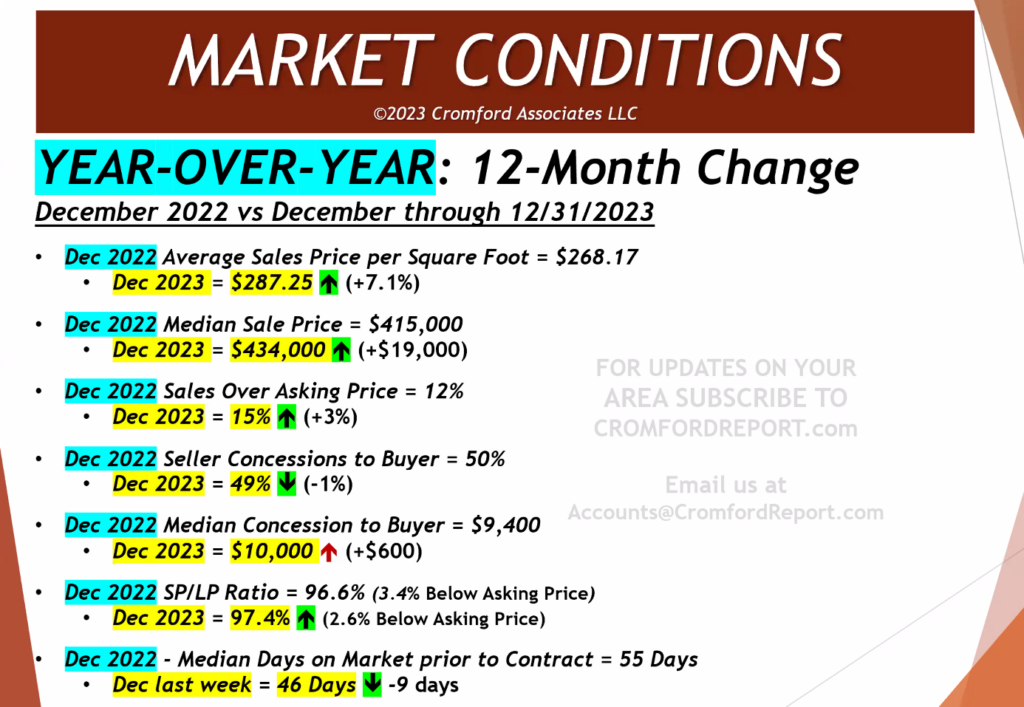
In addition to the savings from declining mortgage rates, December concluded with 49% of sales involving a seller-paid concession to the buyer at the close of escrow, with a median cost to the seller of $10,000. Coolidge had the highest percentage of sales with concessions at 81%, followed by Laveen at 79%. Coolidge has a median sales price of $305,000, with the majority of sales being new construction. Laveen has a median sales price of $436,000, also with a majority of new construction. You’ve probably already picked up on the trend here. Over 76% of all newly constructed home sales that closed through the Arizona Regional MLS noted some form of builder-paid concession. If they were sold for under $500,000, that percentage rises to 82%. The majority of concessions go towards further buying down the buyers’ mortgage rate, temporarily or permanently.

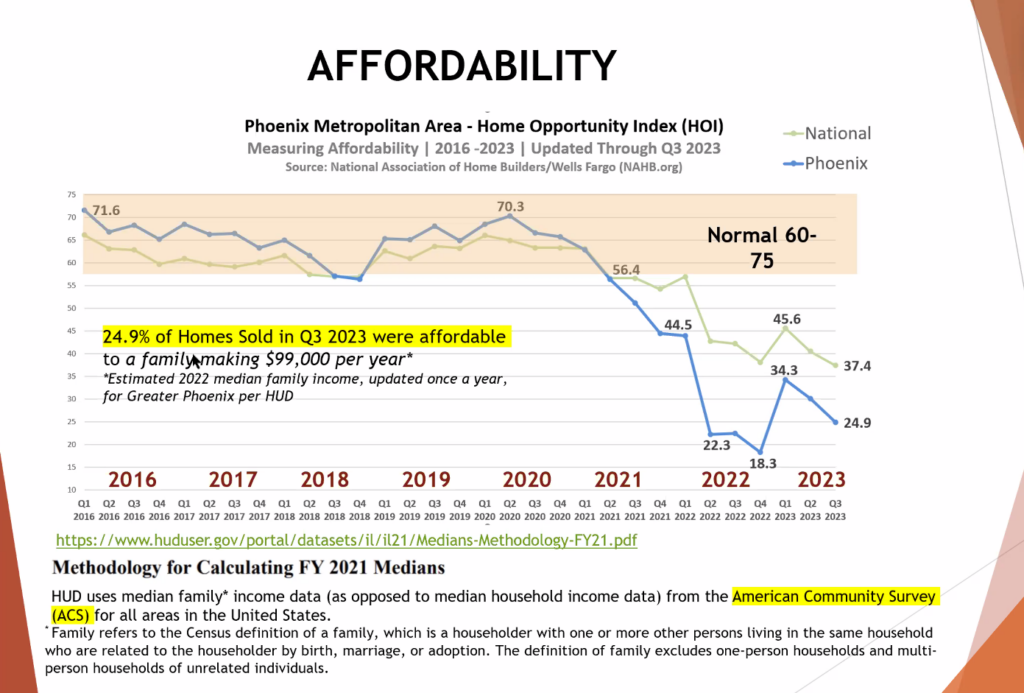
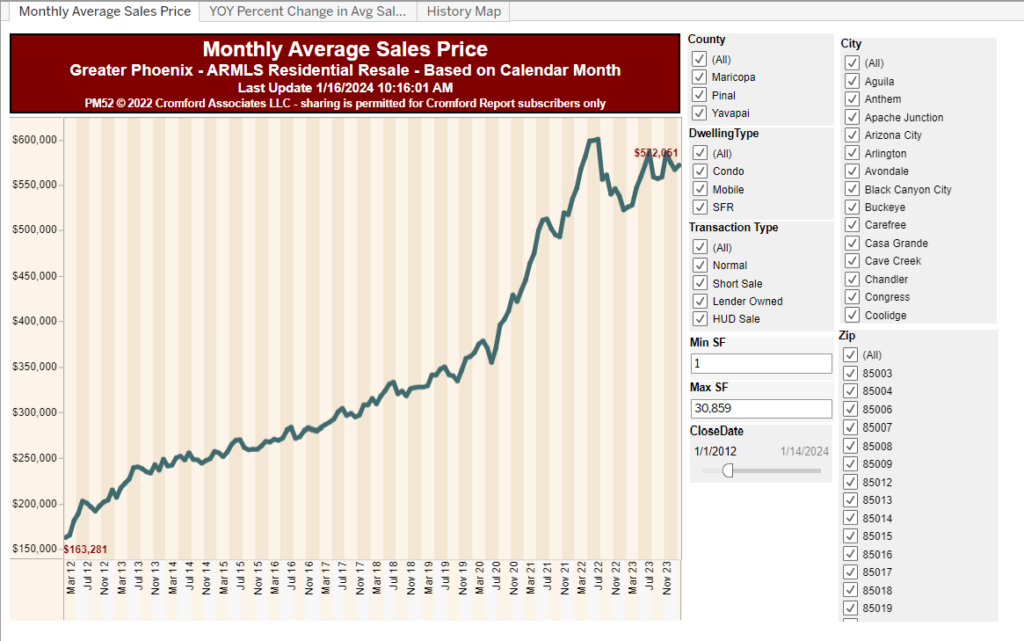
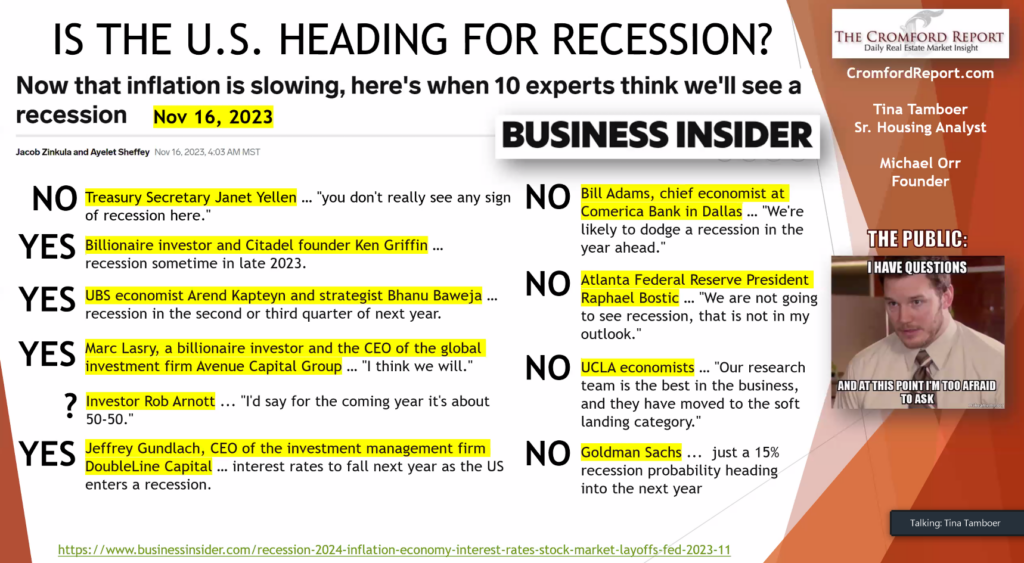
So, what can Greater Phoenix expect for 2024? It’s reasonable to anticipate some relief, not in the form of declining prices but in declining mortgage payments. When combined with rising family incomes, we can expect affordability measures to improve alongside increased demand. It’s not reasonable to expect another frenzied market with skyrocketing prices akin to 2020-2021, or another 12.5% drop in values like 2022. The first quarter might be relatively uneventful in terms of price, but uplifting with more traditional home buyers reentering the market. Things could become more exciting after the Federal Reserve meets again at the end of January and further reveals its plan for the Federal Funds rate in 2024. Stay tuned.


For Sellers:

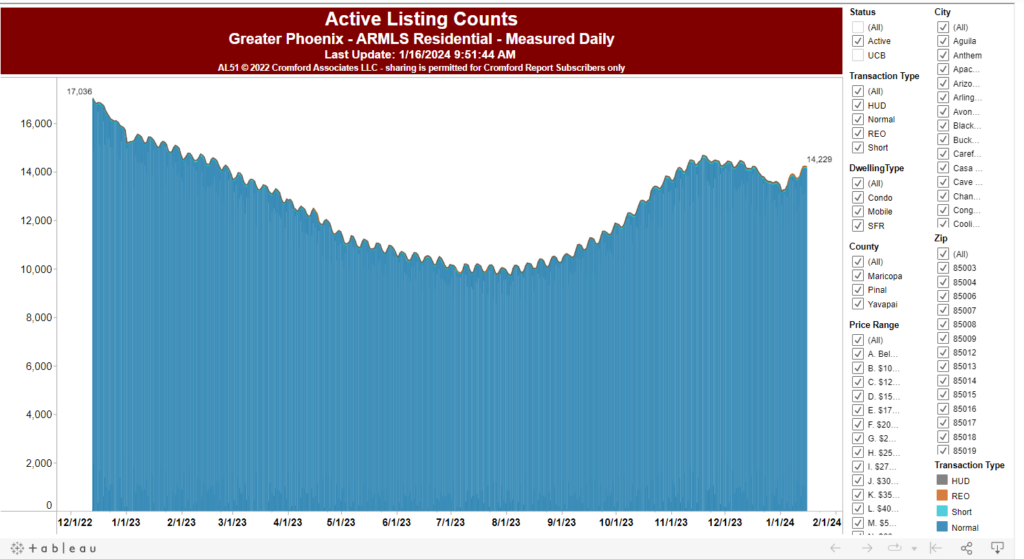
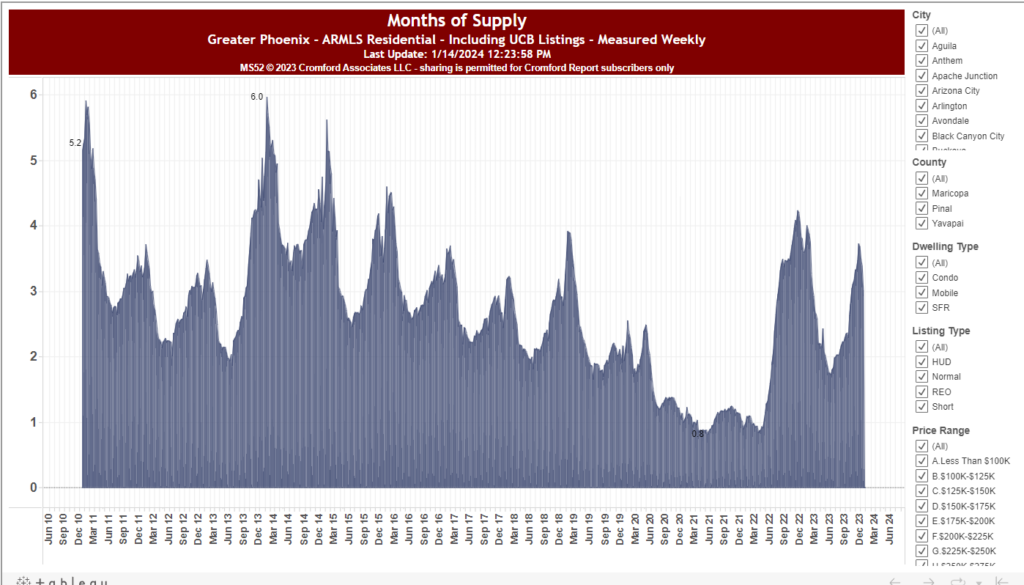
While Greater Phoenix is moving out of a balanced market and showing continuous improvement, the seller’s market remains somewhat weak. Therefore, a combination of good condition and a competitive price continues to be crucial for attracting offers within a reasonable time frame. It’s also important for sellers to maintain an open mind regarding concessions to the buyer. New listings in the first week of January are higher than last year, although not exceptionally high. While inventory is starting to rise moderately, it is still 37% below normal for this time of year.

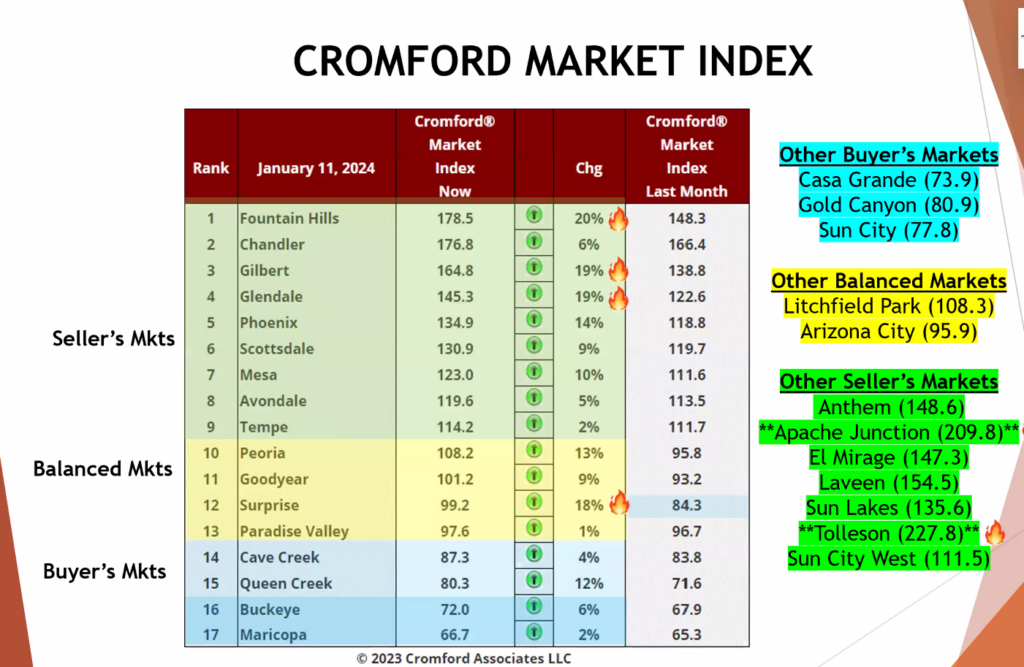
Not all cities are in a seller’s market; the distribution is as follows, from strongest to weakest:

Seller’s Markets:

  • Tolleson
  • Apache Junction
  • Fountain Hills
  • Chandler
  • Gilbert
  • Laveen
  • El Mirage
  • Anthem
  • Glendale
  • Sun Lakes
  • Phoenix
  • Scottsdale
  • Mesa
  • Avondale

Balanced Markets:

  • Tempe
  • Litchfield Park
  • Sun City West
  • Peoria
  • Goodyear
  • Surprise
  • Paradise Valley
  • Arizona City

Buyer’s Markets:

  • Cave Creek
  • Gold Canyon
  • Queen Creek
  • Sun City
  • Casa Grande
  • Buckeye

Most cities are either gradually improving or holding steady in their market measures. Sale price measures in January will reflect December negotiations, but with this turn in the market fueled by lower mortgage rates and seller concessions, we can expect sales price measures to be sustained in the first quarter. The second quarter could get exciting if rates continue to decrease.

In a development that will bring joy to sellers and dismay to housing-crash forecasters, all 17 cities are now showing an increase in their Cromford® Market Index over the past month.

There has been an average increase of 10% in the Cromford® Market Index for the 17 cities, significantly more positive than the 6% increase we recorded last week. The trend in favor of sellers is accelerating as listings go under contract at a faster rate, and supply remains well below normal.

Leading the charge are Fountain Hills, Gilbert, Glendale, and Surprise. The laggards include Tempe, Maricopa, Cave Creek, Avondale, Buckeye, and Paradise Valley, but even these are now improving for sellers.

Nine out of 17 cities are seller’s markets. We have four cities that are balanced and four that remain buyer’s markets.

Last week we recommended mild to moderate optimism for the month of January, and this can be modified to remove the reference to mild. It is a good start to the year, and transaction volumes appear likely to start improving if this trend holds. We will be examining annual sales counts and looking for stability followed by a gentle increase.


In a development that will bring joy to sellers and dismay to housing-crash forecasters, all 17 cities are now showing an increase in their Cromford® Market Index over the past month.

There has been an average increase of 10% in the Cromford® Market Index for the 17 cities, which is significantly more positive than the 6% increase we recorded last week. The trend in favor of sellers is accelerating as listings go under contract at a faster rate, and supply remains well below normal.

Leading the charge are Fountain Hills, Gilbert, Glendale, and Surprise. The laggards include Tempe, Maricopa, Cave Creek, Avondale, Buckeye, and Paradise Valley, but even these are now showing improvement for sellers.

Nine out of 17 cities are seller’s markets. We have four cities that are balanced and four that remain buyer’s markets.

Last week, we recommended removing the reference to mild from our recommendation of mild to moderate optimism for January. It is a strong start to the year, and transaction volumes appear likely to start improving if this trend holds. We will be examining annual sales counts and looking for stability followed by a gentle increase.

The Phoenix metro residential real estate market saw a decrease in both active listings for sale, and listings under contract but a slight rise in the median sales price. Despite a decrease in total monthly sales, the market appears relatively balanced with a stable supply of 76 days.
The HOI data for Phoenix suggests a mixed scenario – while the index trend is positive, affordability challenges persist, impacting a quarter of homes sold.
Noteworthy population shifts in these regions! Queen Creek leads with an 8.2% increase, followed by Maricopa at 6.8%, and Goodyear at 4.2%.
The quantity of active listings reached its peak in mid-November to December 2023 but is expected to rise again this year, presenting new opportunities and challenges for both buyers and sellers.
30-Year Mortgage Rates and the 10-Year Treasury usually go hand in hand. They both tend to drop after a recession, though not always at the same time.
The monthly average sales price continued to rise, reaching its peak in June 2022, only to dip in November 2022. However, there's anticipation for it to rise again.
The average price per square foot has been on a steady rise since 2007. Currently, the price per square foot at contract stands at $291.12, while the price per square foot at final sales is at $285.378. This trend indicates the evolving value of real estate over the years.
The months of supply have experienced a rapid rise and fall, and its current status in the following months shows an increase, although it's still lower compared to its highest peak back in December 2013.
Experts can't agree if the U.S. is heading for a recession. Some think it might happen late in 2024, but others, like Treasury Secretary Janet Yellen, don't see any signs of it coming soon. The future of the economy is a bit uncertain right now. 🤷‍♂️
The Monthly Average Lease Price per Square Foot appears to be stagnant in 2024, although there was a rise compared to previous years.
Some Real estate investor warns of the 'greatest' correction, but recent data suggests no need to wait for foreclosures.
Sales are expected to decrease, with a significant drop in 2023 compared to previous years. It's a noticeable shift in the market dynamics.
Exciting times ahead! Anticipating a median sales price of $435,000 this year brings a positive vibe to the real estate world.
From January 2022 to January 2024, there was a significant increase, with a difference of 8.6%. The anticipated price per square foot is $294.28, with a total of 1,460 sales.
January 2021 took a dip with a 3.2% fallback, but January 2022 bounced back strong with a 7.1% rise. It's like a ride of market fluctuations!
Stock market's a wild ride, especially around elections. It's fascinating to see how world events, from 9/11 to Covid-19, play out in those numbers.
The supply index dropped by 3.3 points, while the market index increased by 9.9 points. Additionally, the demand index rose by 2.8 points. These changes signal a shifting landscape.
The seller's market took a turn into a balanced market, but there's anticipation for it to climb back up. It's like a dynamic dance in the real estate world, always changing!
Every city is different but the outskirts of the valley are typically buyers markets where new builds are happening.
January saw concessions at $9,500, down from December's $10,000.
The market is looking strong, with homes selling closer to the asking price (SP/LP Ratio improved from 96.6% to 97.4%). Plus, homes are spending less time on the market – down from 55 to 46 days in December.
Exciting news in January 2024! Lower mortgage rates favor buyers, and the Cromford Market Index is signaling a return to a Seller's Market.

Whether you have questions or are ready to dive into the market, we're here to assist you! 🏡

📱 Contact us at (480) 466-4917

📧 Email us at jay@jaybrugroup.com

Leave a Reply

Top Posts

SUBSCRIBE TO OUR POSTS