March 2024 RE Market Update
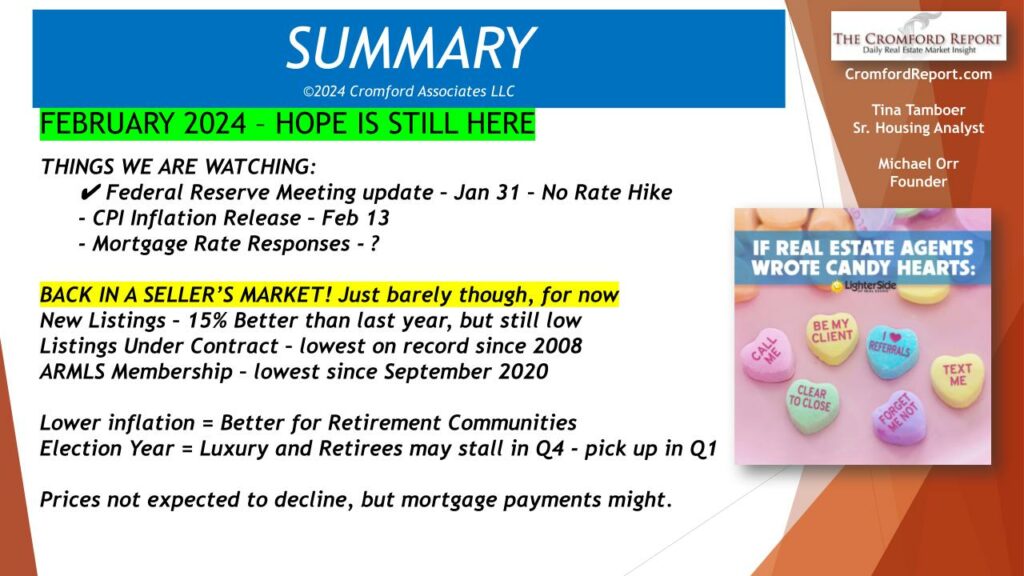
Welcome to my blog on the AZ Real Estate market, thanks for reading, I appreciate all of you. If I was to describe the market in one word, it would be BORING. Here’s why.
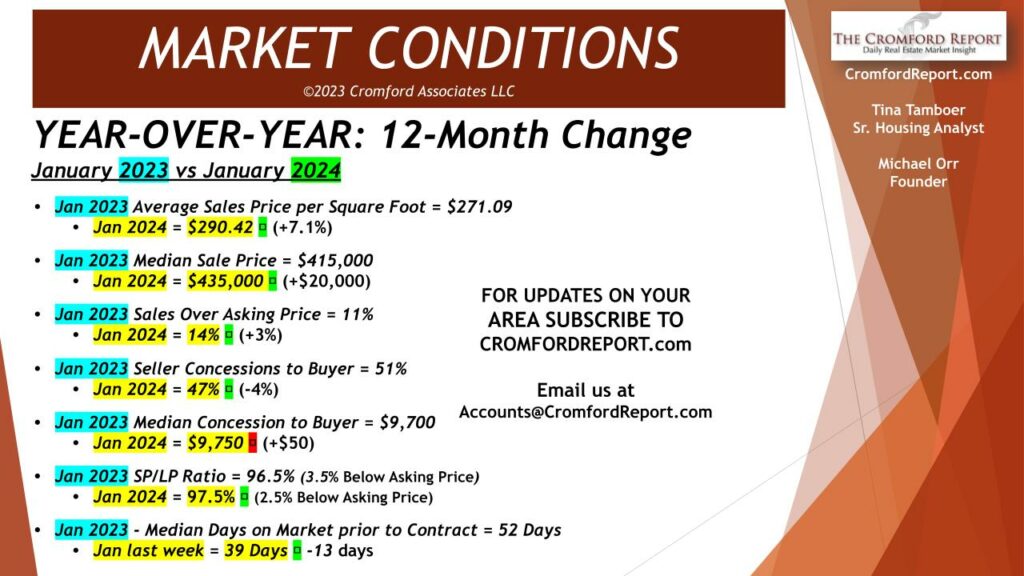
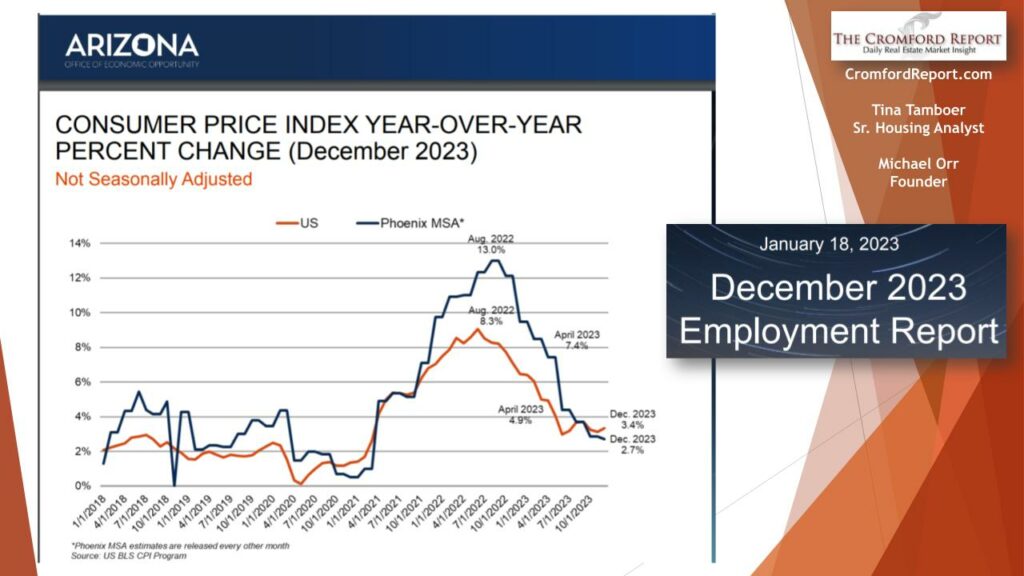
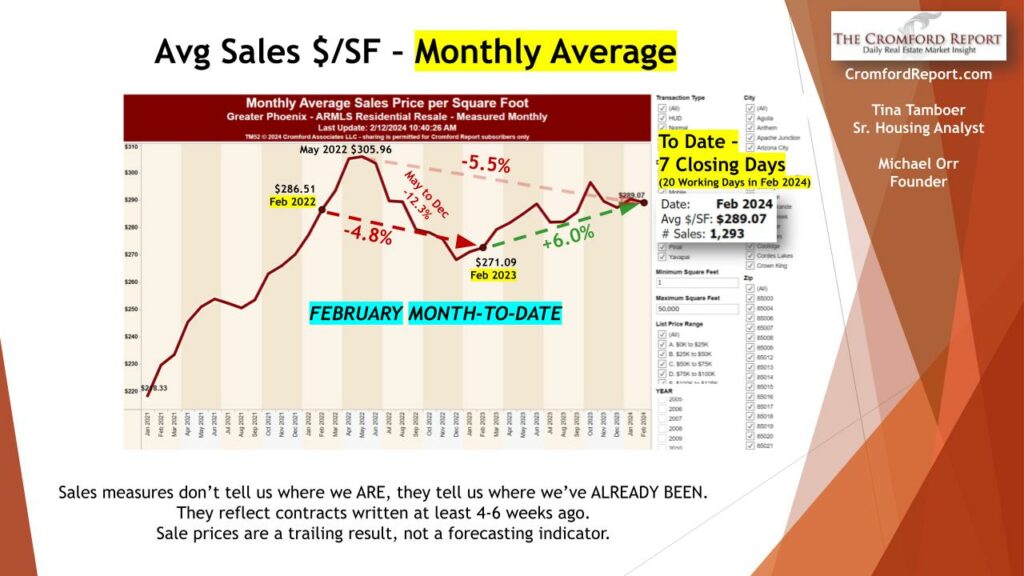
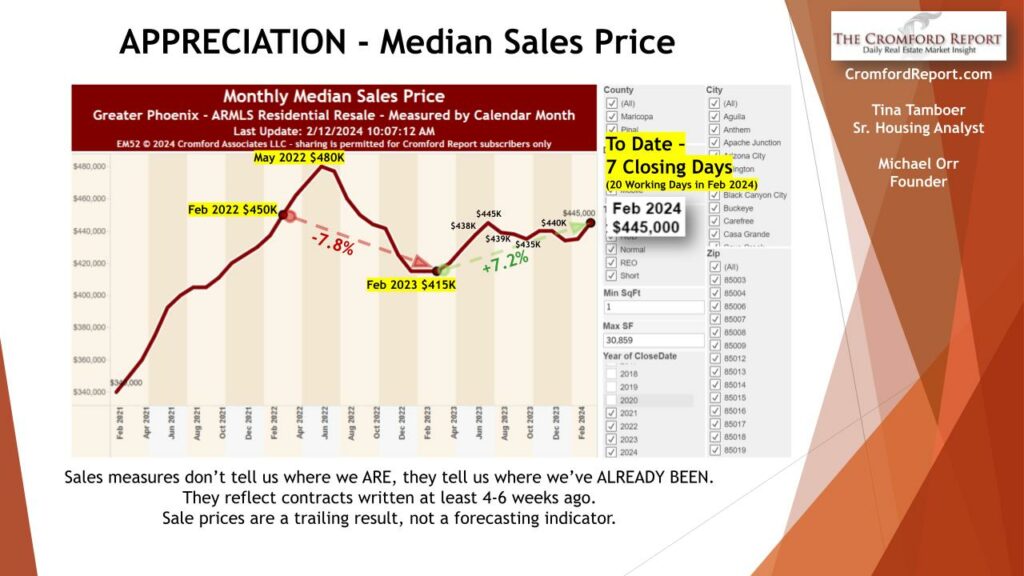
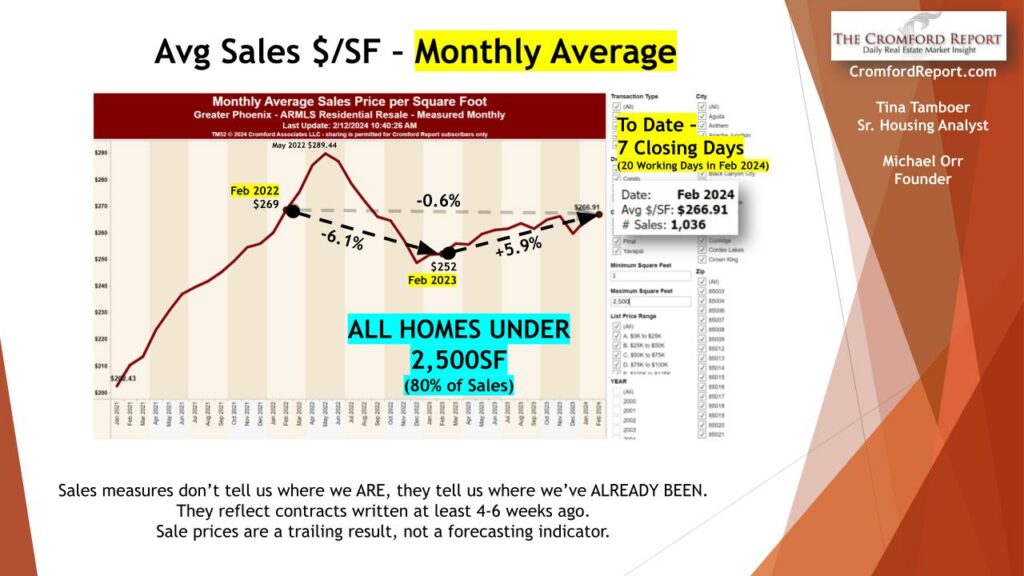
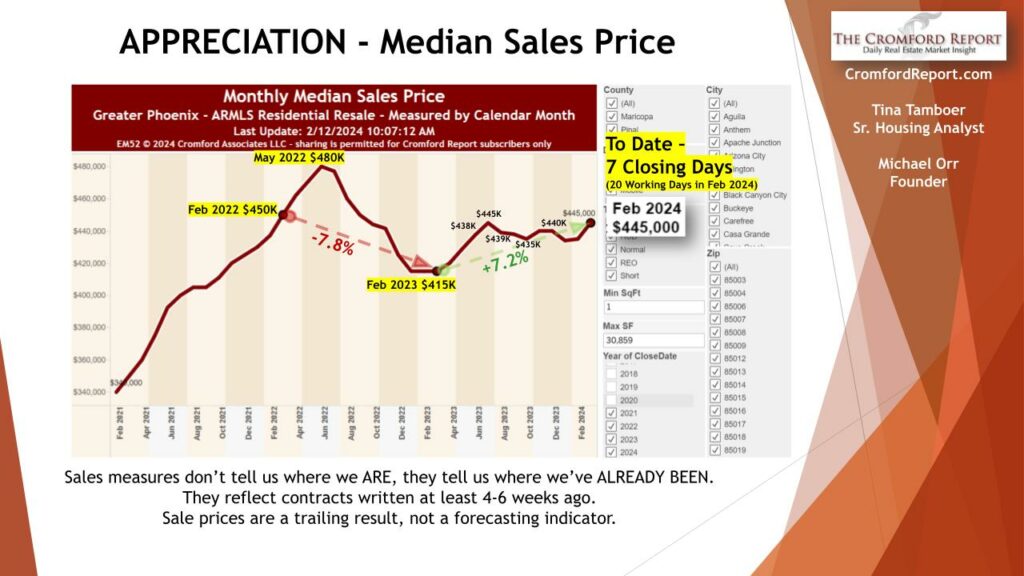
- Prices are level, and not moving much.
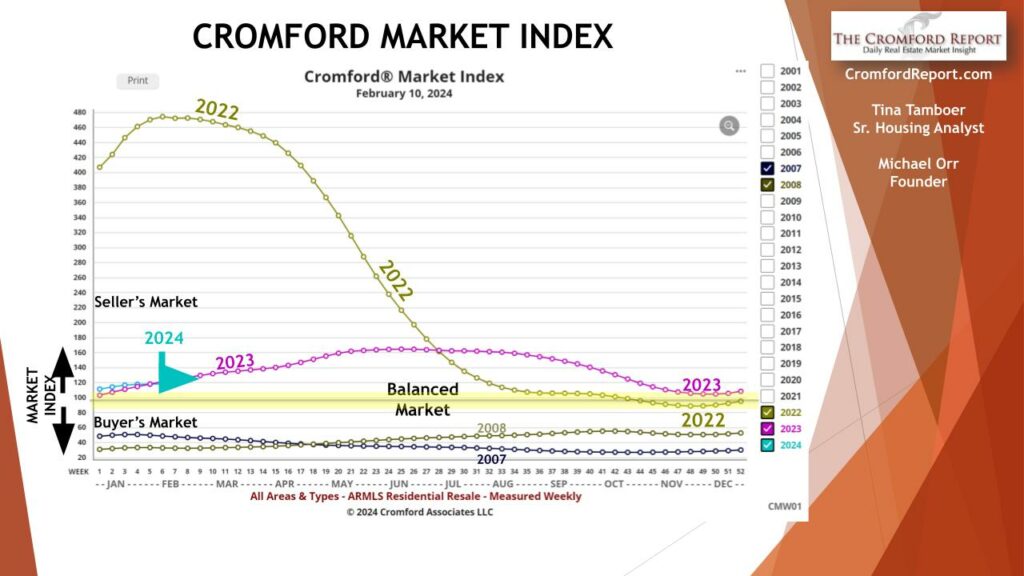
- Contracts ratio is very low, not many sales going on. Lowest since 2008.
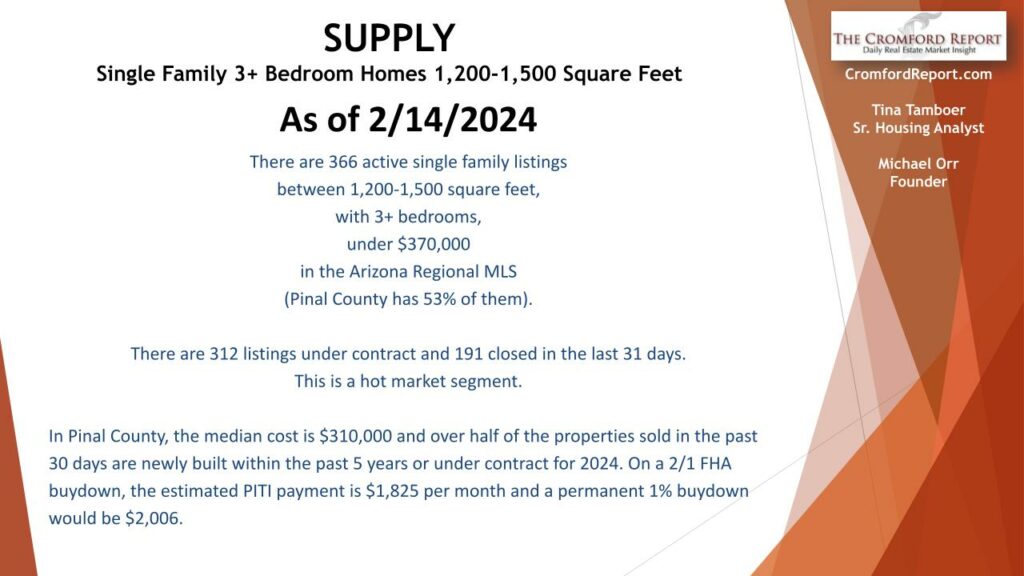
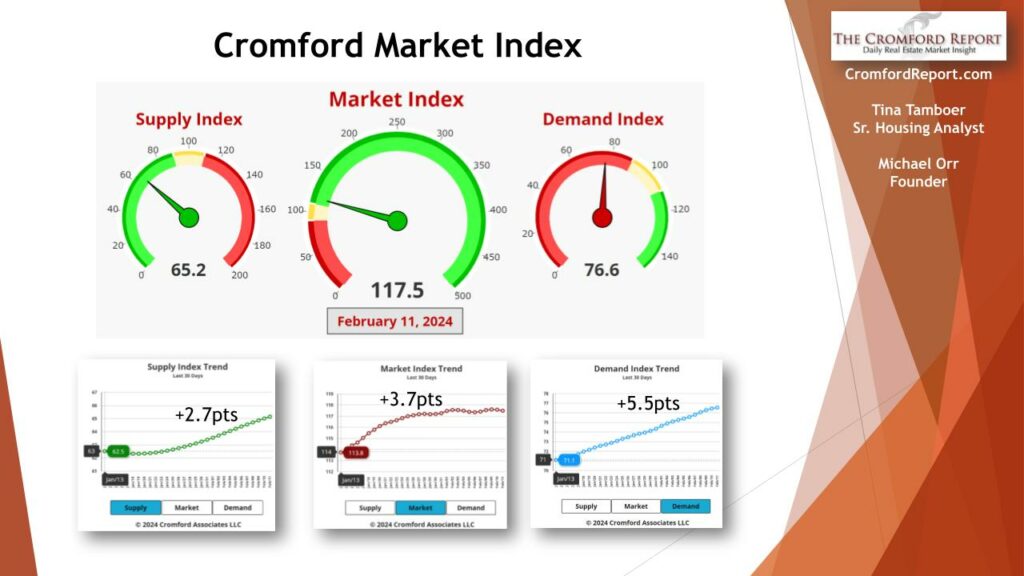
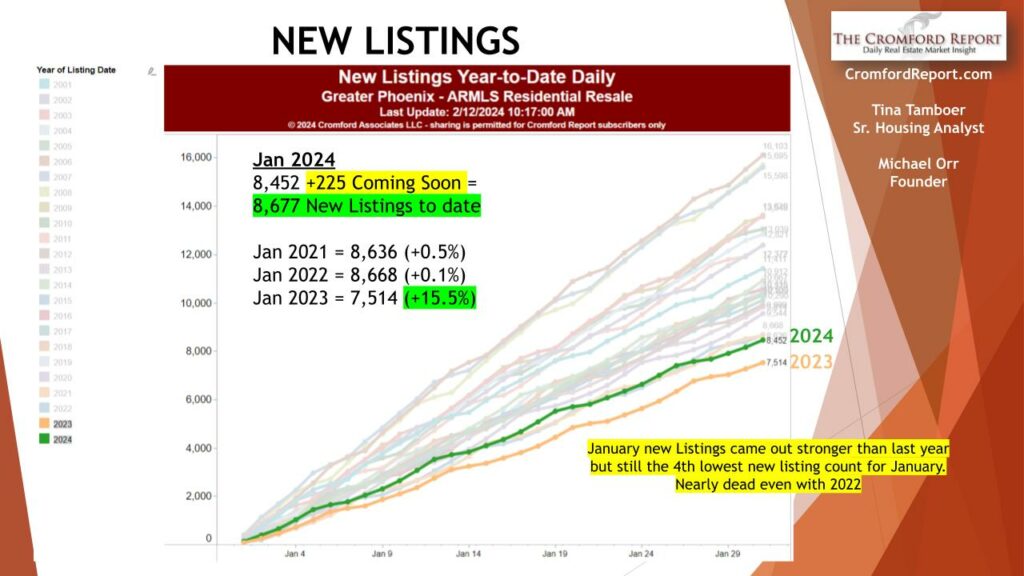
- Supply is still low but rising very little.
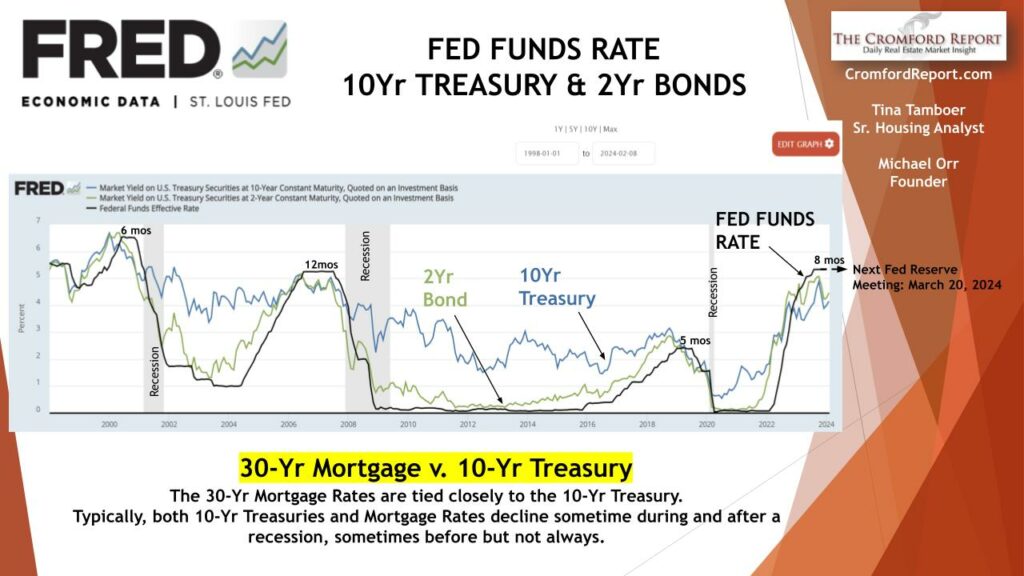
- Elections will not affect interest rates.
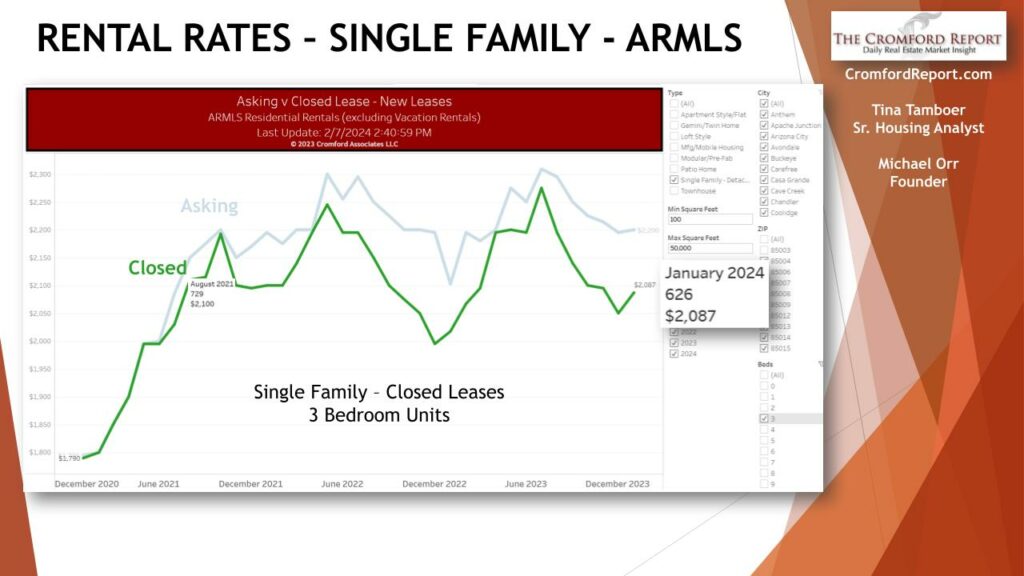
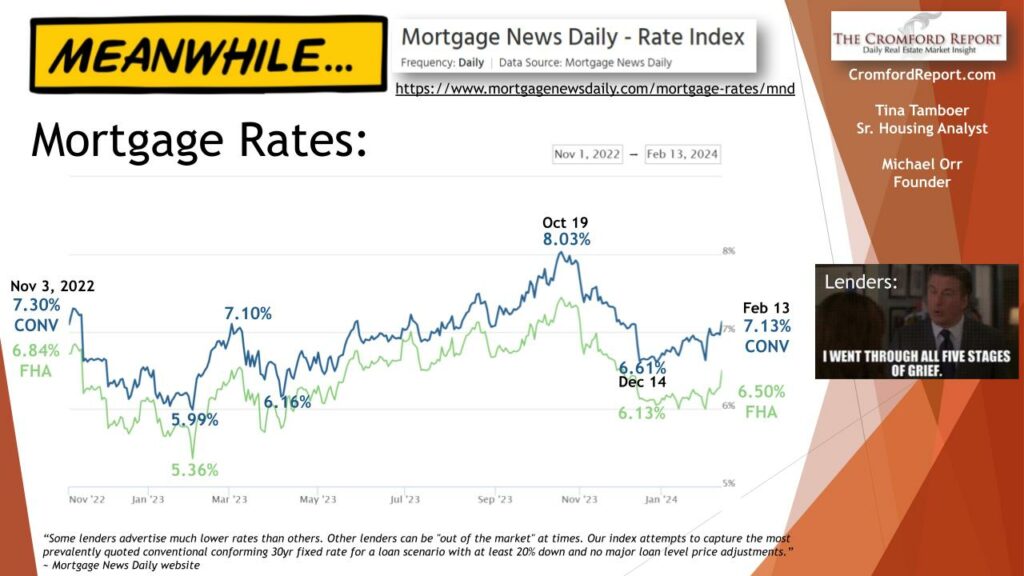
- Interest rates are still high and there is no sign of coming down that much. Possibly 2-3 rate drop this year but they may not be enough to be over 1%
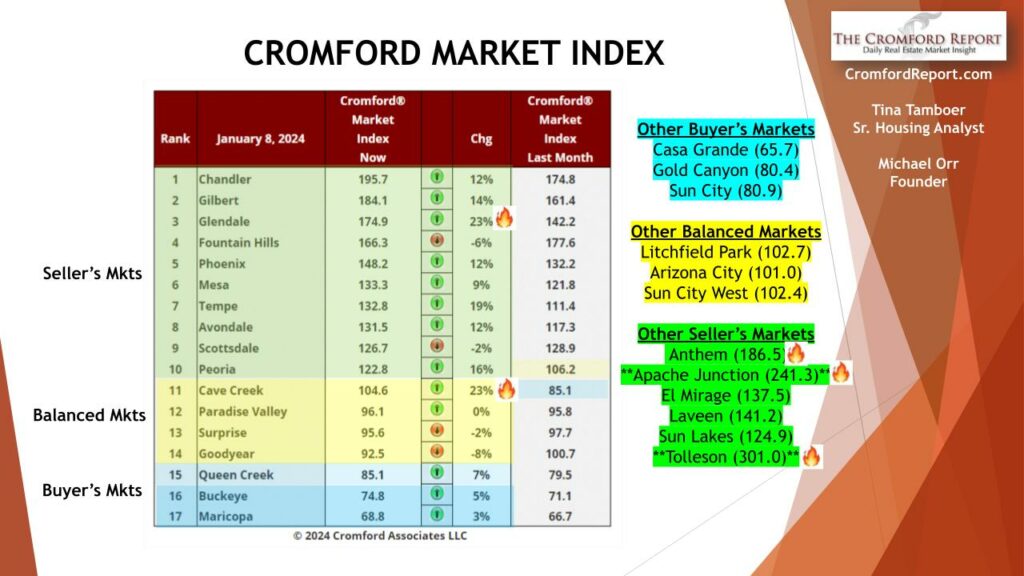
- Chandler/Gilbert market is the best sellers market. A good quality of living and still close to all cities with good prices.
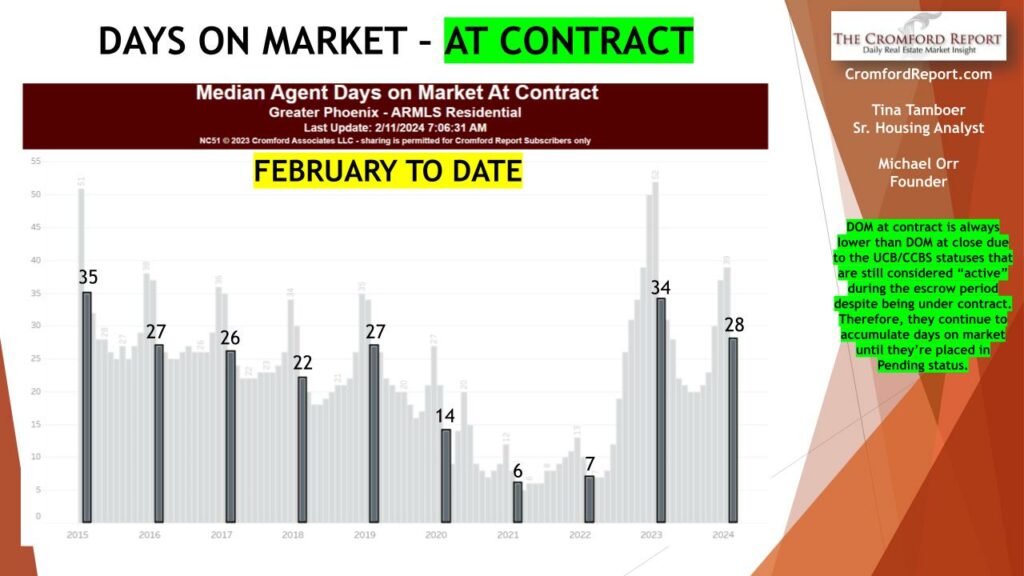
- Days on the market is 28 days.
480-466-4917 or jay@jaybrugroup.com
Jay Bru
Mid Month Pricing Update and Forecast
Each month about this time we look back at the previous month, analyze how pricing has behaved and report on how well our forecasting techniques performed. We also give a forecast for how pricing will move over the next month.
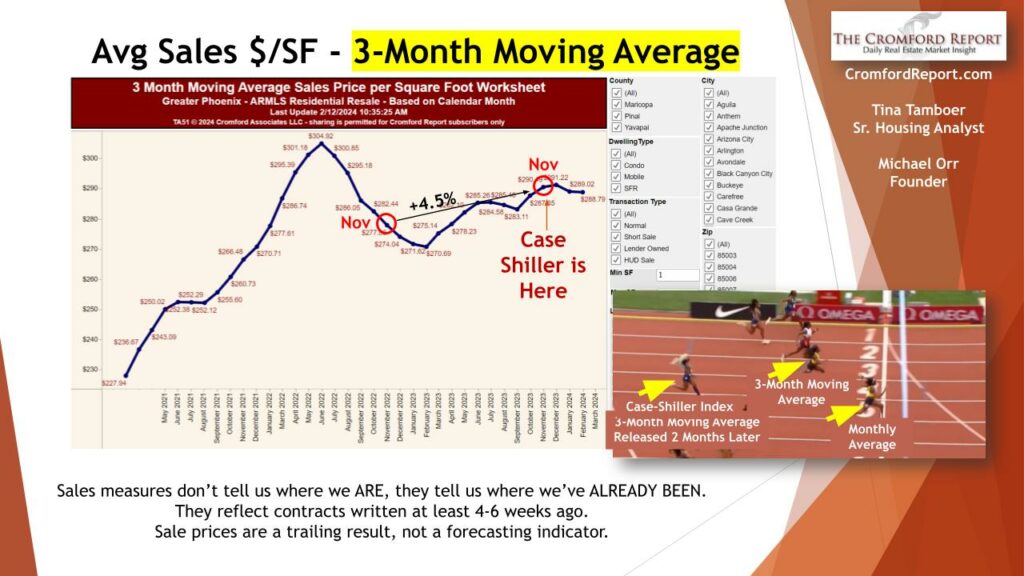
For the monthly period ending February 15, we are currently recording a sales $/SF of $288.80 averaged for all areas and types across the ARMLS database. This is up 1.5% from the $284.49 we now measure for January 15. Our forecast range mid-point was $289.77, so we claim a good result for our forecast last month. The actual result was 97 cents, or 0.3% below our forecast.
On February 15 the pending listings for all areas & types show an average list $/SF of $327.07, down 2.6% from the reading for February 15. Among those pending listings we have 99.0% normal, 0.2% in REOs and 0.8% in short sales and pre-foreclosures. This is a very low level of distress, though we are continuing to see a handful of short sales from people who purchased at the height of the 2022 price wave and have since faced financial difficulty.
Our mid-point forecast for the average monthly sales $/SF on February 15 is $279.28, which is 3.0% below the February 15 reading. We have a 90% confidence that it will fall within ± 2% of this mid point, i.e. in the range $273.69 to $284.87.
This outlook reflects the steep fall in the $/SF for pending listings over the last month. The average $/SF for pending listings started off the year at almost $340 and has trended down by almost $15 since then. The average $/SF for active listings has gone the opposite way, increasing from $358 to $376. This is not exactly a positive sign. Sellers of high-end homes are becoming more dominant in the active number, with an increasing number of expensive homes which are not selling as fast as they are arriving on the market. Homes at the low end remain in short supply and are tending to sell much more quickly. If low-end homes sell fast while high-end homes remain on the market, this can push the closed $/SF in a downward direction.
If the market balance was strongly in favor of sellers we could rely on an overall upward trend to keep the average closed $/SF moving higher. However we only have a slight advantage to sellers with the CMI at 117, and this advantage is refusing to grow. We remain cautious about the market unless we see a significant movement towards lower interest rates and thus higher affordability.
Feb 27 – The latest S&P / Case-Shiller® Home Price Index® numbers were published this Tuesday.
The new report covers home sales during the period October to December 2023. This means the typical home sale closed in mid November, more than 3 months ago. Please remember that Case-Shiller data is fairly old, even on the day it is released.
We have 3 of the 20 cities showing rising prices for last month, with a lower index for Phoenix for the second time in 10 months. 17 cities declined over the last month with Minneapolis the most affected.
Comparing with the previous month’s series we see the following changes:
- Miami +0.3%
- Las Vegas +0.2%
- Los Angeles +0.1%
- Washington -0.0%
- New York -0.0%
- Atlanta -0.1%
- Charlotte -0.1%
- Chicago -0.2%
- Tampa -0.3%
- Denver -0.5%
- Seattle -0.5%
- Phoenix -0.6%
- Detroit -0.7%
- Cleveland -0.7%
- Dallas -0.7%
- San Diego -0.8%
- Boston -0.8%
- San Francisco -0.9%
- Portland -1.0%
- Minneapolis -1.0%
Phoenix has dropped from 11th to 12th place since last month. The national average increase month to month was -0.4%, so Phoenix fell just below that standard.
Comparing year over year, we see the following changes:
- San Diego +8.8%
- Los Angeles +8.3%
- Detroit +8.3%
- Chicago +8.1%
- Charlotte +8.0%
- Miami +7.8%
- New York +7.6%
- Cleveland +7.4%
- Boston +7.2%
- Atlanta +6.3%
- Washington +5.1%
- Las Vegas +4.2%
- Tampa +4.1%
- Phoenix +3.8%
- San Francisco +3.2%
- Seattle +3.0%
- Minneapolis +2.9%
- Denver +2.3%
- Dallas +2.2%
- Portland +0.3%
Phoenix remained in 14th place, and is still in the bottom half on a year-over-year basis. All 20 of the cities are now showing positive price movement from one year ago with Portland once again doing relatively poorly. Southern California is now showing the highest annual appreciation, closely followed by Detroit and Chicago.
The national average is +3.0% year over year. Phoenix is therefore exceeding that percentage, in contrast to last month.
Feb 26 – Supply is stronger than it was this time last year. It is likely to increase further in 2024 because the number of single-family building permits issued in January was 2,720 across Maricopa and Pinal counties. This is up a massive 147% from January 2023 when we counted only 1,102. The home builders appear to be in an ebullient mood. This is in growing contrast to the re-sale industry which is still struggling with low volumes and weak demand.
The January 2024 count is the highest monthly total since May 2022.
Here are some
Home Prices
The East valley has been doing very well especially Chandler.
Supply
If you have questions about your city or zip code, let me know. Every market is different! Reach out to me at 480-466-4917 or email me at jay@jaybrugroup.com
Have a successful week!


